Oakland A's Attendance in Context
Comparing Oakland A's attendance with team performance and league trends, and examining what those patterns can tell us.
The Oakland Athletics’ departure from the Bay Area has been attributed to low attendance. But was it really that simple? This analysis examines decades of attendance data and team performance to see how the A’s compared to the rest of Major League Baseball.
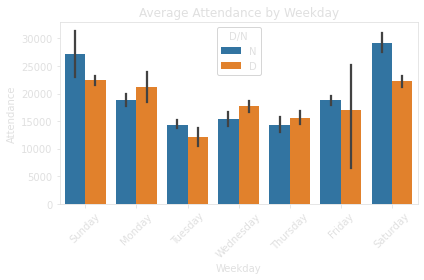
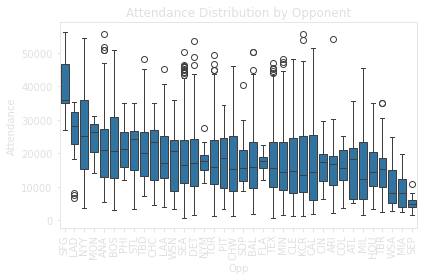
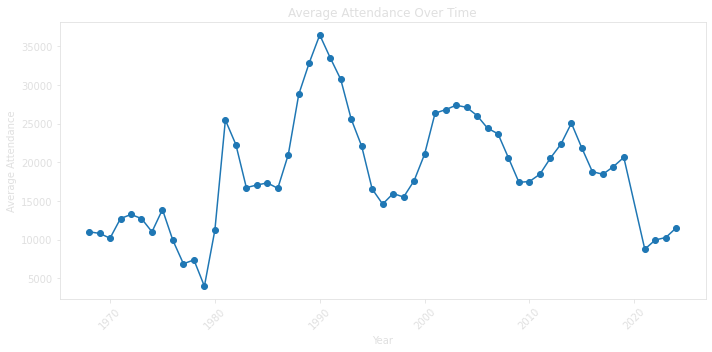
To understand Oakland’s attendance in context, we need to compare it to the rest of the league.
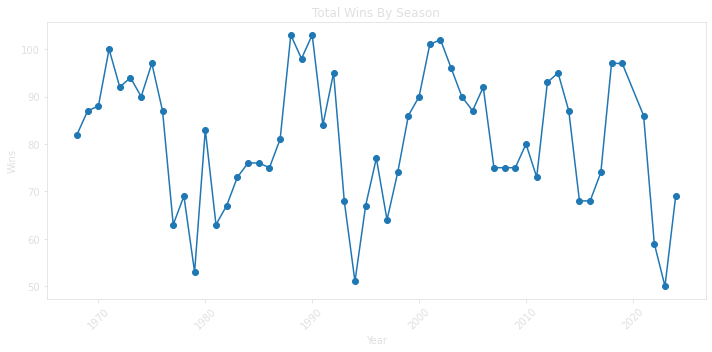
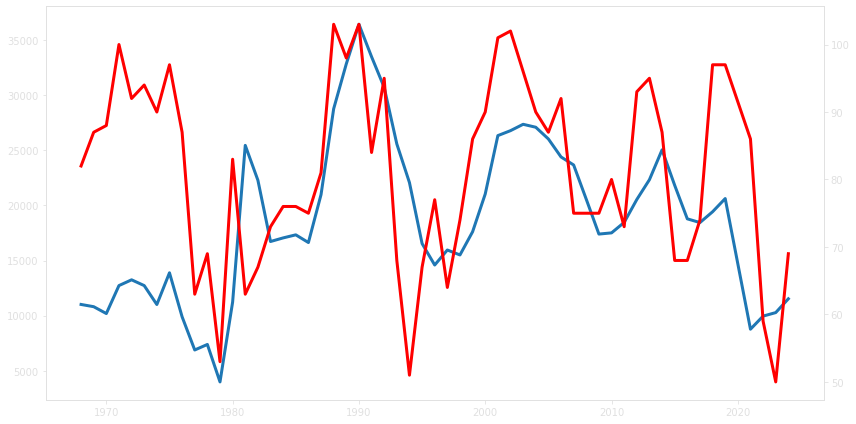
The league-wide comparisons show that Oakland’s attendance was often near the bottom of MLB, including in competitive seasons. This is a descriptive comparison, not an estimate that controls for other influences on attendance.
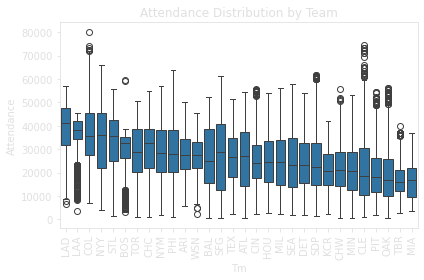
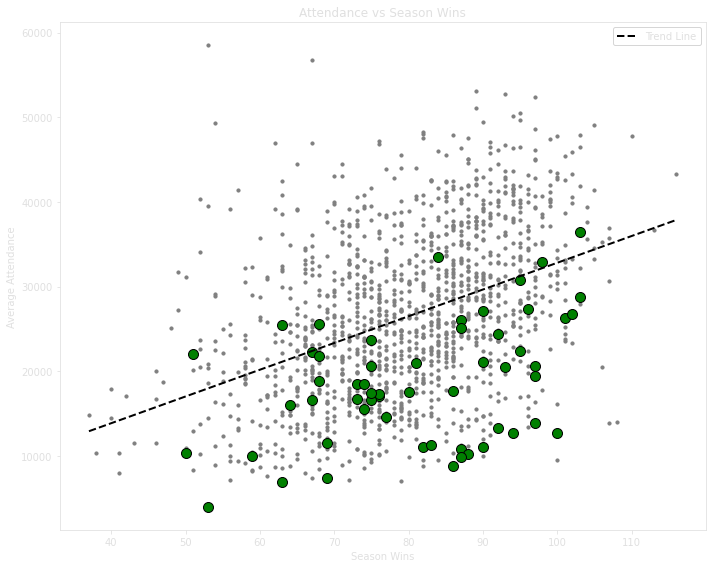
The attendance-versus-wins plot shows Oakland below the trend line in many seasons, including seasons with more than 90 wins. Teams with similar win totals can have very different attendance, suggesting that on-field performance alone does not capture the full picture.
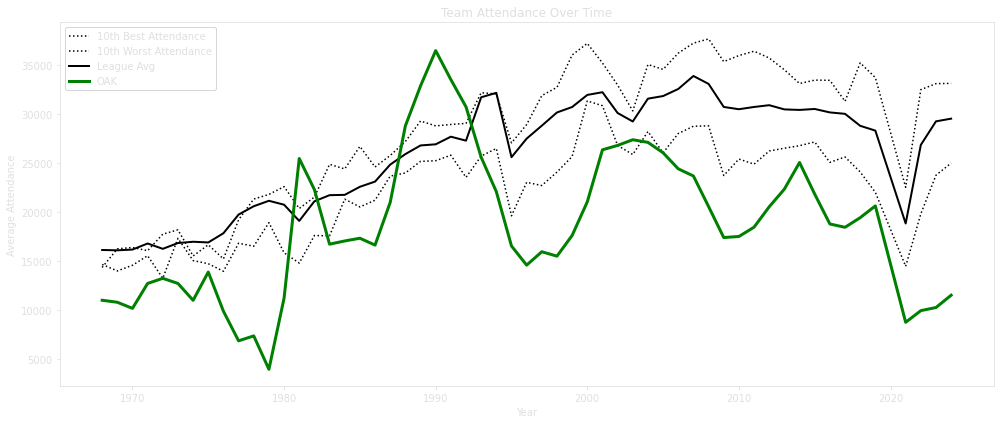
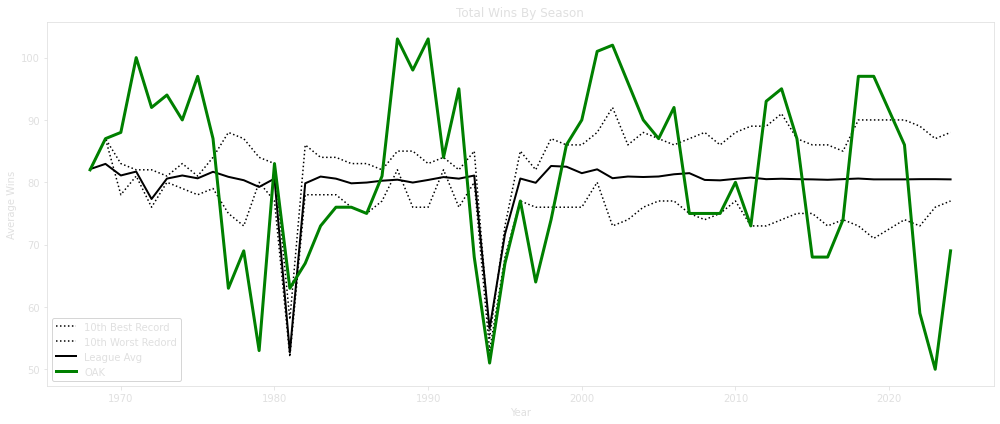
These comparisons show that low attendance persisted in some successful Oakland seasons. They do not establish why fans attended fewer games or whether the market could support a team under different conditions.
Ownership decisions, ticket prices, stadium conditions, and uncertainty surrounding relocation are possible influences that this analysis does not isolate. Attendance records and win totals alone cannot separate those explanations or establish the causes of the move. The narrower conclusion is that winning and attendance did not move together consistently; explaining that gap requires additional data.
All data sourced from Baseball-Reference.com via pybaseball